ERI Infrastructure Intelligence | Infrastructure Round-up | May–July 2026

Geopolitical Instability & Industrial Transformation ( Detailed Article)
Geopolitical Instability & Industrial Transformation ( Detailed Article)
Executive Summary
Ongoing geopolitical tensions involving Pakistan, Iran, and Israel—combined with the fragile or failed ceasefire dynamics—are reshaping global economic fundamentals. Strategic chokepoints such as the Strait of Hormuz have amplified volatility in energy markets, triggering cascading effects across industrial sectors.
This whitepaper integrates strategic analysis + data-driven insights to assess the implications for mining, construction, and infrastructure industries, with a focus on fuel costs, investments, and multi-horizon impact.
1. The New Reality: Fragile Ceasefires, Persistent Risk
The current geopolitical environment is defined by:
Incomplete diplomatic resolutions
Recurring escalation cycles
Structural uncertainty in energy and trade routes
Unlike past conflicts, today’s instability is prolonged and systemic, influencing:
Commodity pricing
Investment cycles
Industrial cost structures
2. Energy Shock: Quantifying the First-Order Impact
2.1 Oil & Fuel Price Dynamics
|
Scenario |
Oil Price Movement |
Industrial Impact |
|---|---|---|
|
Conflict escalation |
+30% to +50% |
Immediate cost surge |
|
Fragile ceasefire |
-10% to -15% (temporary) |
Volatility persists |
|
Prolonged instability |
Sustained high band |
Structural inflation |
Transmission Channels
- Diesel → Mining operations
- Bitumen → Road construction
- Logistics → All infrastructure projects
Fuel accounts for 25–50% of operating costs in mining and heavy construction.
2.2 Inflation & Interest Rate Linkage
|
Indicator |
Expected Impact |
|---|---|
|
Inflation |
+200–300 bps |
|
Interest Rates |
Elevated / restrictive |
|
Liquidity |
Tightening bias |
Higher inflation leads to higher borrowing costs, directly affecting infrastructure financing.
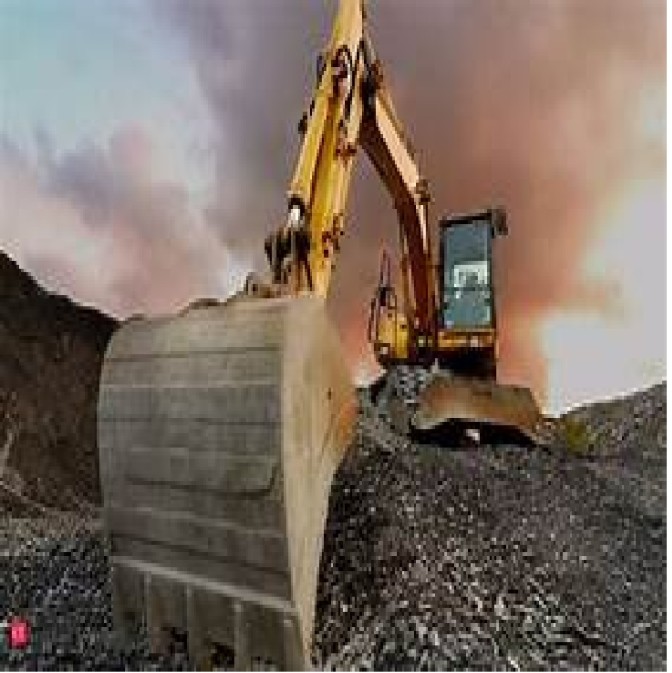
3. Mining Sector: Data-Backed Impact Analysis
3.1 Cost Structure Sensitivity
|
Cost Component |
Share of Total Cost |
Risk Level |
|---|---|---|
|
Fuel (diesel) |
30–50% |
High |
|
Logistics |
15–25% |
High |
|
Labor |
10–15% |
Medium |
|
Explosives & inputs |
5–10% |
Medium |
A 10% increase in fuel prices can reduce mining EBITDA margins by 2–4%.
3.2 Commodity Price Outlook
|
Time Frame |
Price Trend |
Driver |
|---|---|---|
|
Short-term |
Spike |
Supply disruption |
|
Medium-term |
Volatile |
Demand slowdown |
|
Long-term |
Bullish (select metals) |
Energy transition |
Critical Minerals Shift
Investment momentum increasing in:
Copper
Cobalt
Lithium
Strategic repositioning toward future-facing commodities is accelerating.
4. Construction Sector: Cost Escalation Model
4.1 Input Cost Inflation Breakdown
|
Input |
Price Sensitivity to Oil |
Impact |
|---|---|---|
|
Steel |
High |
↑ structural costs |
|
Cement |
Medium |
↑ project cost |
|
Bitumen |
Very High |
↑ road infra cost |
|
Transport |
Very High |
↑ logistics |
Overall project cost escalation: 5–15% in high volatility scenarios
4.2 Margin Impact Simulation
|
Scenario |
EBITDA Margin Impact |
|---|---|
|
Stable fuel |
Baseline |
|
+20% fuel cost |
-3% to -5% margin |
|
+40% fuel cost |
-6% to -10% margin |
Fixed-price contracts face severe margin compression
5. Infrastructure Sector: Investment & Capital Flow Analysis
5.1 Government Investment Trends
|
Time Horizon |
Policy Response |
|---|---|
|
Short-term |
Subsidies, inflation control |
|
Medium-term |
Selective infrastructure prioritization |
|
Long-term |
Strategic & energy-focused infra |
Key Shift:
From growth-driven infra → security-driven infra
5.2 Private Investment Behavior
|
Factor |
Impact |
|---|---|
|
Risk perception |
Increased |
|
Cost of capital |
Rising |
|
Project approvals |
Slower |
Infrastructure projects face:
Delayed financial closures
Lower private participation
6. Macroeconomic Transmission Model
Geopolitical Conflict → Oil Prices → Inflation → Interest Rates → Investment Slowdown → Industrial Impact
Quantified Effects:
Global GDP impact: up to -1% in extreme scenarios
Capex slowdown: 10–20% in sensitive sectors
7. Time-Based Impact Framework
7.1 Short-Term (0–6 Months)
Key Indicators:
Oil volatility
Freight disruption
Input cost spikes
Sector Impact:
Mining: Margin pressure
Construction: Cost overruns
Infrastructure: Tender delays
7.2 Medium-Term (6–24 Months)
Adjustments:
Supply chain diversification
Energy sourcing changes
Capital discipline
Sector Impact:
Mining: Increased exploration
Construction: Cost normalization at higher levels
Infrastructure: Selective execution
7.3 Long-Term (2–10 Years)
Structural Transformation:
Energy transition acceleration
Localization of supply chains
Strategic autonomy
Sector Impact:
Mining: Growth in critical minerals
Construction: Expansion in logistics & renewable infra
Infrastructure: Mega investments in resilience
8. India Outlook: Strategic Positioning
India sits at a critical intersection of risk and opportunity.
Risks
High oil import dependency
Inflationary pressures
Infrastructure cost escalation
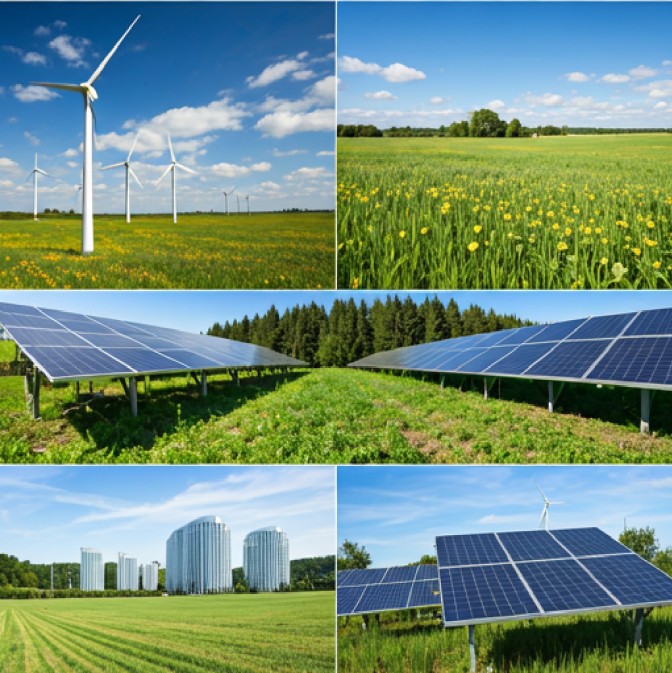
Opportunities
Domestic mining expansion
Renewable energy push
Infrastructure localization
India’s long-term fundamentals remain intact, but short-term volatility is elevated
9. Strategic Playbook for Industry Leaders
Mining
Fuel hedging strategies
Diversification into critical minerals
Logistics optimization
Construction
Shift to variable-cost contracts
Strengthen procurement frameworks
Focus on margin protection
Infrastructure
Align with government-backed projects
De-risk financing
Invest in energy-linked infrastructure
10. Conclusion: Turning Volatility into Strategy
The breakdown or fragility of ceasefire efforts is not a temporary disruption—it represents a new structural paradigm.
Key Takeaways:
Energy volatility is the primary risk driver
Capital allocation must incorporate geopolitical scenarios
Long-term winners will be those who adapt early
Organizations that integrate data-driven decision-making with geopolitical awareness will transform risk into sustainable competitive advantage.
Most Popular